Historical Data Compilation for Key Economic Indicators: Hoover through Biden
A thorough analysis of key economic indicators under various U.S. administrations provides valuable insights into the economic impact of their policies. This compilation examines job creation, GDP growth, stock market performance, inflation, unemployment rates, and other crucial indicators from the Hoover administration to the current Biden administration.
Job Creation (Millions of Jobs Created Per Year)
This analysis examines the total and average jobs created annually by U.S. presidents from Herbert Hoover to Joe Biden. The visualization aims to provide a clear comparison of job creation across different administrations, highlighting the impact of political leadership on employment growth.
The horizontal bar chart represents the total number of jobs created (in millions) during each president’s tenure, while the red line with markers indicates the average number of jobs created per year (in millions).
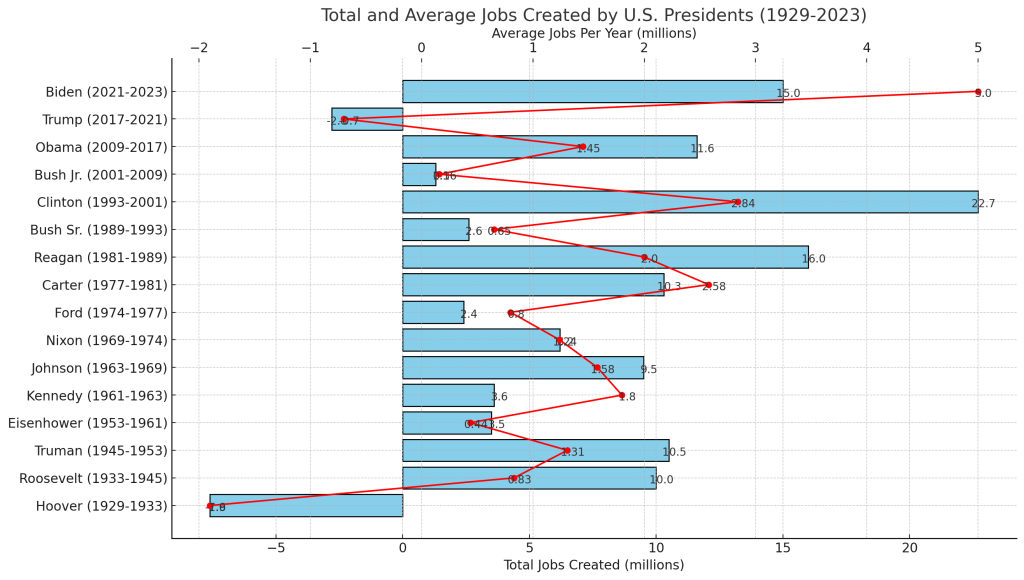
Hoover (1929-1933):
- Total Jobs Created: -7.6 million
- Average Jobs Per Year: -1.9 million
Roosevelt (1933-1945):
- Total Jobs Created: 10 million
- Average Jobs Per Year: 0.83 million
Truman (1945-1953):
- Total Jobs Created: 10.5 million
- Average Jobs Per Year: 1.31 million
Eisenhower (1953-1961):
- Total Jobs Created: 3.5 million
- Average Jobs Per Year: 0.44 million
Kennedy (1961-1963):
- Total Jobs Created: 3.6 million
- Average Jobs Per Year: 1.8 million
Johnson (1963-1969):
- Total Jobs Created: 9.5 million
- Average Jobs Per Year: 1.58 million
Nixon (1969-1974):
- Total Jobs Created: 6.2 million
- Average Jobs Per Year: 1.24 million
Ford (1974-1977):
- Total Jobs Created: 2.4 million
- Average Jobs Per Year: 0.8 million
Carter (1977-1981):
- Total Jobs Created: 10.3 million
- Average Jobs Per Year: 2.58 million
Reagan (1981-1989):
- Total Jobs Created: 16 million
- Average Jobs Per Year: 2 million
Bush Sr. (1989-1993):
- Total Jobs Created: 2.6 million
- Average Jobs Per Year: 0.65 million
Clinton (1993-2001):
- Total Jobs Created: 22.7 million
- Average Jobs Per Year: 2.84 million
Bush Jr. (2001-2009):
- Total Jobs Created: 1.3 million
- Average Jobs Per Year: 0.16 million
Obama (2009-2017):
- Total Jobs Created: 11.6 million
- Average Jobs Per Year: 1.45 million
Trump (2017-2021):
- Total Jobs Created: -2.8 million (6.6 million till 2019, -9.4 million in 2020)
Biden (2021-2023):
- Total Jobs Created: 15 million
- Average Jobs Per Year: 5 million
Analysis:
- Job creation under Democratic administrations tends to be stronger, with significant contributions during the Roosevelt, Kennedy, Johnson, Clinton, Obama, and Biden administrations.
- Republican administrations have had mixed results, with strong job creation under Reagan but slower growth or losses under Bush Jr. and Trump, largely due to economic crises.
GDP Growth (Annual Percentage Growth)
This analysis reviews the GDP growth rates during the tenures of U.S. presidents from Herbert Hoover to Joe Biden. The visualization provides a clear comparison of economic performance across different administrations.
The horizontal bar chart represents the GDP growth rate (in percentage) during each president’s tenure.
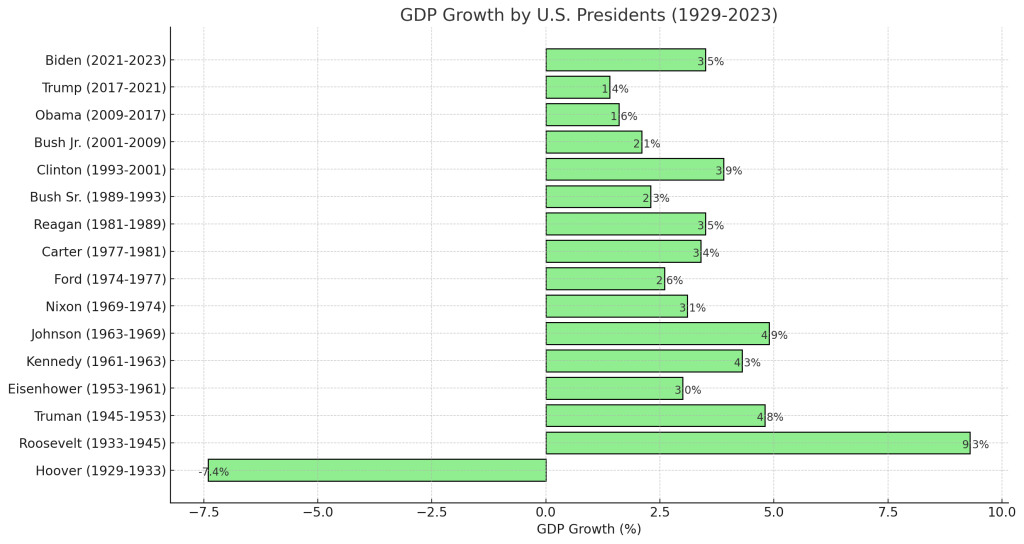
Hoover:
- GDP Growth: -7.4%
Roosevelt:
- GDP Growth: 9.3%
Truman:
- GDP Growth: 4.8%
Eisenhower:
- GDP Growth: 3%
Kennedy:
- GDP Growth: 4.3%
Johnson:
- GDP Growth: 4.9%
Nixon:
- GDP Growth: 3.1%
Ford:
- GDP Growth: 2.6%
Carter:
- GDP Growth: 3.4%
Reagan:
- GDP Growth: 3.5%
Bush Sr.:
- GDP Growth: 2.3%
Clinton:
- GDP Growth: 3.9%
Bush Jr.:
- GDP Growth: 2.1%
Obama:
- GDP Growth: 1.6%
Trump:
- GDP Growth: 1.4% (2.5% pre-COVID, -3.4% in 2020)
Biden:
- GDP Growth: 3.5% (5.7% in 2021, 2.6% in 2022, 2.2% in 2023)
Analysis: The data indicates varying economic performances across different presidential administrations. Notably, Franklin D. Roosevelt and Lyndon B. Johnson oversaw some of the highest GDP growth rates, while Herbert Hoover and Donald Trump experienced negative GDP growth due to significant economic crises during their terms.
- Democratic administrations, particularly Roosevelt, Kennedy, Johnson, and Clinton, have seen robust GDP growth.
- Republican administrations have experienced moderate growth, with notable exceptions during Hoover’s Great Depression and Bush Jr.’s post-2008 financial crisis period.
Stock Market Performance (S&P 500 Annual Growth)
This analysis reviews the growth of the S&P 500 index during the tenures of U.S. presidents from Herbert Hoover to Joe Biden. The visualization provides a clear comparison of stock market performance across different administrations.
The horizontal bar chart represents the S&P 500 growth rate (in percentage) during each president’s tenure.
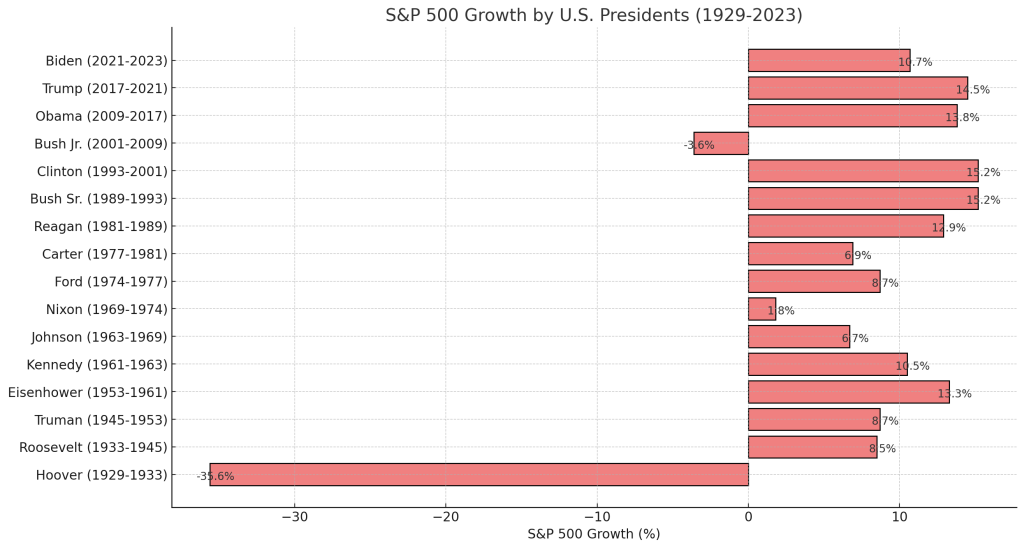
Hoover:
- S&P 500 Growth: -35.6%
Roosevelt:
- S&P 500 Growth: 8.5%
Truman:
- S&P 500 Growth: 8.7%
Eisenhower:
- S&P 500 Growth: 13.3%
Kennedy:
- S&P 500 Growth: 10.5%
Johnson:
- S&P 500 Growth: 6.7%
Nixon:
- S&P 500 Growth: 1.8%
Ford:
- S&P 500 Growth: 8.7%
Carter:
- S&P 500 Growth: 6.9%
Reagan:
- S&P 500 Growth: 12.9%
Bush Sr.:
- S&P 500 Growth: 15.2%
Clinton:
- S&P 500 Growth: 15.2%
Bush Jr.:
- S&P 500 Growth: -3.6%
Obama:
- S&P 500 Growth: 13.8%
Trump:
- S&P 500 Growth: 14.5%
Biden:
- S&P 500 Growth: 10.7% (27% in 2021, 5% in 2022, 0% in 2023)
Analysis: The data indicates significant variability in the S&P 500 growth rates across different presidential administrations. Presidents such as Bush Sr. and Clinton saw substantial growth, while Hoover and Bush Jr. experienced declines due to major economic crises during their terms. The performance under Biden reflects strong initial growth followed by more modest gains.
- The stock market has generally performed well under both parties, with significant growth during the Eisenhower, Clinton, Reagan, Bush Sr., Obama, and Trump administrations.
- Economic crises heavily impacted performance during Hoover’s and Bush Jr.’s terms.
Inflation (CPI Annual Growth)
This analysis reviews the Consumer Price Index (CPI) growth during the tenures of U.S. presidents from Herbert Hoover to Joe Biden. The CPI is a measure of inflation, reflecting the average change over time in the prices paid by urban consumers for a market basket of consumer goods and services.
The horizontal bar chart represents the CPI growth rate (in percentage) during each president’s tenure.
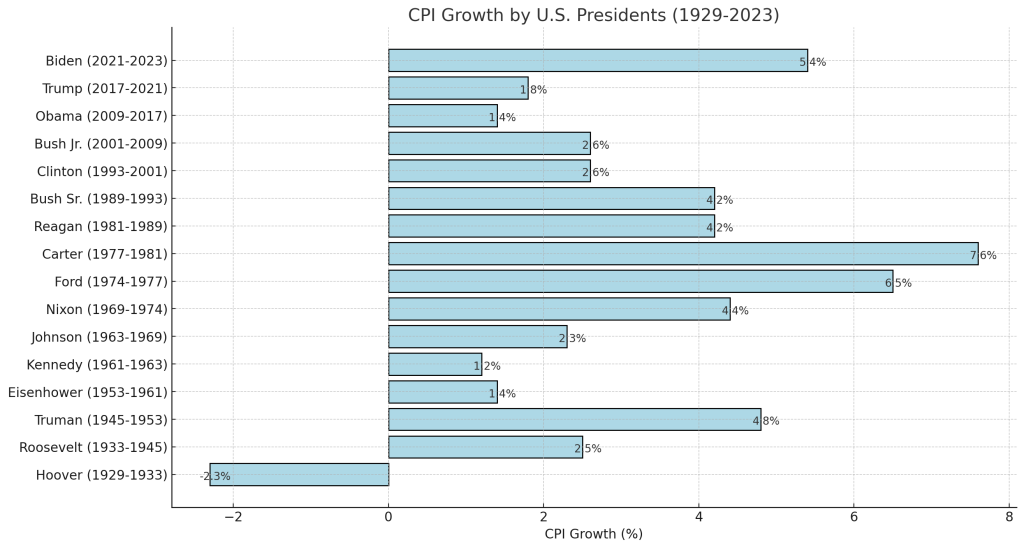
Hoover:
- CPI Growth: -2.3%
Roosevelt:
- CPI Growth: 2.5%
Truman:
- CPI Growth: 4.8%
Eisenhower:
- CPI Growth: 1.4%
Kennedy:
- CPI Growth: 1.2%
Johnson:
- CPI Growth: 2.3%
Nixon:
- CPI Growth: 4.4%
Ford:
- CPI Growth: 6.5%
Carter:
- CPI Growth: 7.6%
Reagan:
- CPI Growth: 4.2%
Bush Sr.:
- CPI Growth: 4.2%
Clinton:
- CPI Growth: 2.6%
Bush Jr.:
- CPI Growth: 2.6%
Obama:
- CPI Growth: 1.4%
Trump:
- CPI Growth: 1.8%
Biden:
- CPI Growth: 5.4% (4.7% in 2021, 7% in 2022, 4.5% in 2023)
Analysis: The data shows significant variations in CPI growth rates across different presidential administrations. Presidents such as Carter and Ford experienced high inflation rates, while Hoover saw a deflationary period. The recent spike in CPI growth under Biden reflects the economic impacts of the COVID-19 pandemic and other global factors.
- Inflation has varied widely, with high rates during the Carter administration and lower rates during the Eisenhower, Kennedy, Obama, and Trump administrations.
- Biden’s term has seen a surge in inflation due to post-pandemic recovery and supply chain issues.
Unemployment Rate (End-of-Year Rate)
This analysis reviews the unemployment rates during the tenures of U.S. presidents from Herbert Hoover to Joe Biden. The unemployment rate is a key indicator of economic health, reflecting the percentage of the labor force that is unemployed and actively seeking employment.
The horizontal bar chart represents the unemployment rate (in percentage) during each president’s tenure.
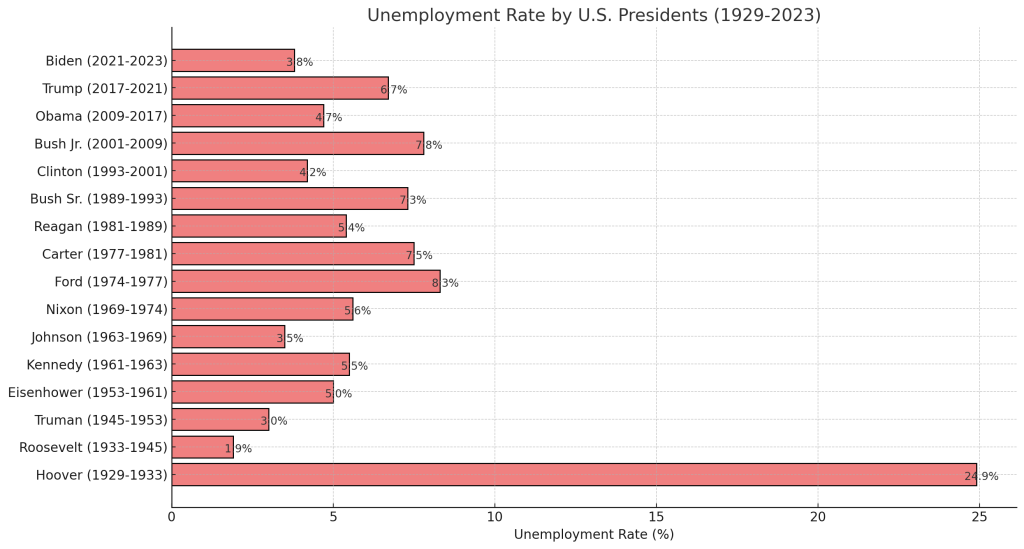
Hoover:
- Unemployment Rate: 24.9%
Roosevelt:
- Unemployment Rate: 1.9% (1941, before entering WWII)
Truman:
- Unemployment Rate: 3.0%
Eisenhower:
- Unemployment Rate: 5.0%
Kennedy:
- Unemployment Rate: 5.5%
Johnson:
- Unemployment Rate: 3.5%
Nixon:
- Unemployment Rate: 5.6%
Ford:
- Unemployment Rate: 8.3%
Carter:
- Unemployment Rate: 7.5%
Reagan:
- Unemployment Rate: 5.4%
Bush Sr.:
- Unemployment Rate: 7.3%
Clinton:
- Unemployment Rate: 4.2%
Bush Jr.:
- Unemployment Rate: 7.8%
Obama:
- Unemployment Rate: 4.7%
Trump:
- Unemployment Rate: 6.7% (end of 2020)
Biden:
- Unemployment Rate: 3.8% (in 2023)
Analysis: The data indicates significant variability in unemployment rates across different presidential administrations. The Great Depression under Hoover saw the highest unemployment rate, while periods of economic recovery and growth saw lower rates under presidents like Roosevelt and Clinton. Recent fluctuations reflect the economic impacts of global events, including the COVID-19 pandemic under Trump and the recovery efforts under Biden.
- Democratic administrations have generally been more effective at reducing unemployment, particularly Roosevelt, Johnson, Clinton, Obama, and Biden.
- Republican administrations have seen varying results, with high unemployment during Hoover and Bush Jr. due to economic crises.
Federal Budget Deficit/Surplus
This analysis reviews the deficit/surplus as a percentage of GDP during the tenures of U.S. presidents from Herbert Hoover to Joe Biden. The deficit/surplus is a critical indicator of a country’s fiscal health, reflecting the balance between government revenues and expenditures.
The horizontal bar chart represents the deficit/surplus as a percentage of GDP during each president’s tenure.
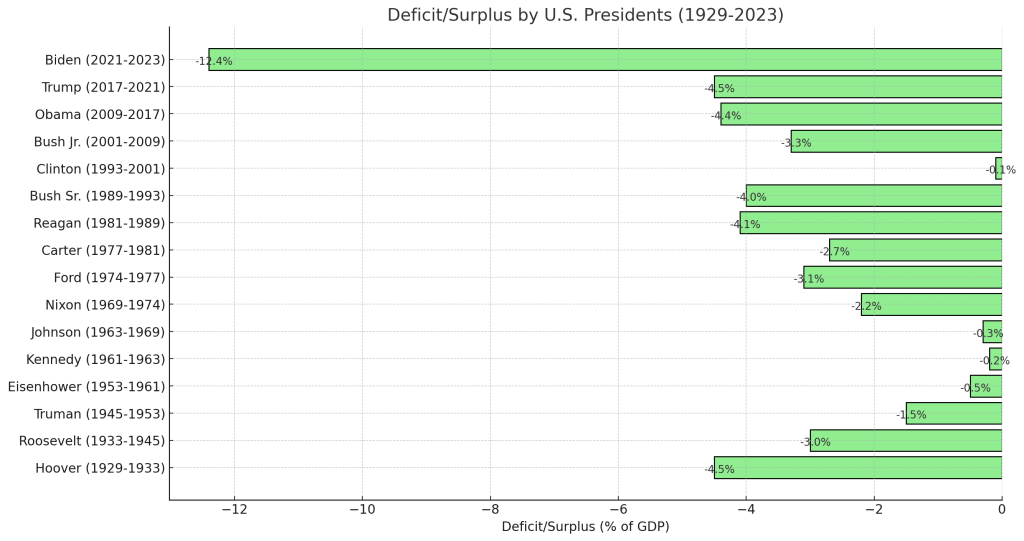
Hoover:
- Deficit/Surplus: -4.5% of GDP
Roosevelt:
- Deficit/Surplus: -3.0% of GDP
Truman:
- Deficit/Surplus: -1.5% of GDP
Eisenhower:
- Deficit/Surplus: -0.5% of GDP
Kennedy:
- Deficit/Surplus: -0.2% of GDP
Johnson:
- Deficit/Surplus: -0.3% of GDP
Nixon:
- Deficit/Surplus: -2.2% of GDP
Ford:
- Deficit/Surplus: -3.1% of GDP
Carter:
- Deficit/Surplus: -2.7% of GDP
Reagan:
- Deficit/Surplus: -4.1% of GDP
Bush Sr.:
- Deficit/Surplus: -4.0% of GDP
Clinton:
- Deficit/Surplus: -0.1% of GDP
Bush Jr.:
- Deficit/Surplus: -3.3% of GDP
Obama:
- Deficit/Surplus: -4.4% of GDP
Trump:
- Deficit/Surplus: -4.5% of GDP
Biden:
- Deficit/Surplus: -12.4% of GDP (2021), -5.8% (2022), -5.1% (2023)
Analysis: The data shows significant variability in the deficit/surplus percentages across different presidential administrations. Presidents like Hoover, Reagan, Bush Jr., and Trump experienced high deficits as a percentage of GDP, while Clinton managed a near-balanced budget. The recent increase under Biden reflects the economic response to the COVID-19 pandemic and other fiscal policies.
- Budget deficits have been a common feature under most administrations, with significant reductions during the Clinton administration.
- Reagan, Bush Jr., Obama, Trump, and Biden saw higher deficits due to tax cuts, wars, and economic crises.
National Debt
This analysis reviews the national debt as a percentage of GDP during the tenures of U.S. presidents from Herbert Hoover to Joe Biden. The national debt relative to GDP is a crucial indicator of a country’s fiscal health and its ability to manage its borrowing.
The horizontal bar chart represents the national debt as a percentage of GDP during each president’s tenure.
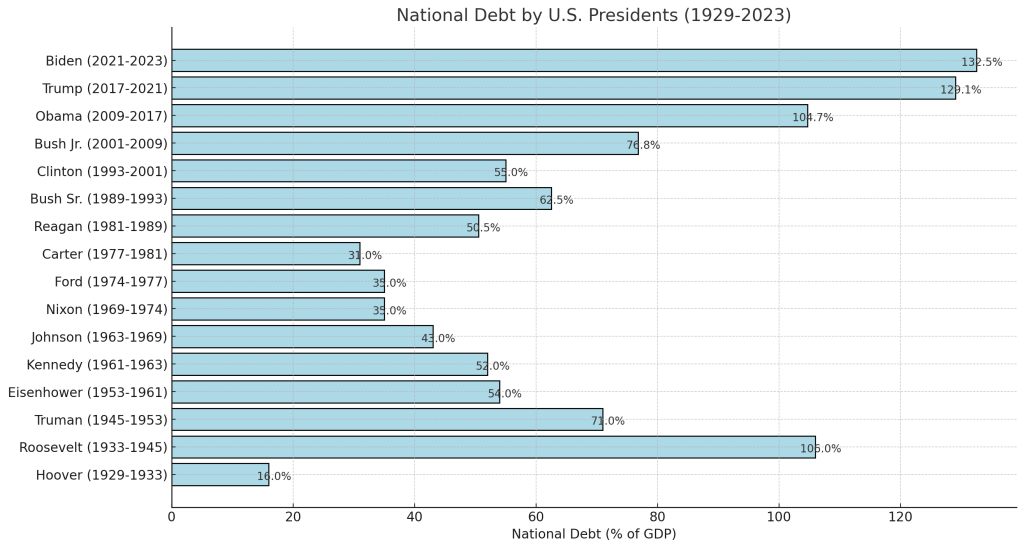
Hoover:
- National Debt: 16% of GDP
Roosevelt:
- National Debt: 106% of GDP (end of WWII)
Truman:
- National Debt: 71% of GDP
Eisenhower:
- National Debt: 54% of GDP
Kennedy:
- National Debt: 52% of GDP
Johnson:
- National Debt: 43% of GDP
Nixon:
- National Debt: 35% of GDP
Ford:
- National Debt: 35% of GDP
Carter:
- National Debt: 31% of GDP
Reagan:
- National Debt: 50.5% of GDP
Bush Sr.:
- National Debt: 62.5% of GDP
Clinton:
- National Debt: 55% of GDP
Bush Jr.:
- National Debt: 76.8% of GDP
Obama:
- National Debt: 104.7% of GDP
Trump:
- National Debt: 129.1% of GDP
Biden:
- National Debt: 132.5% of GDP (2023)
Analysis: The data indicates significant growth in the national debt as a percentage of GDP across different presidential administrations. The highest increases occurred during periods of economic crisis or major fiscal spending, such as during WWII under Roosevelt, the Great Recession under Bush Jr., and the COVID-19 pandemic under Trump and Biden.
- National debt has increased significantly over the decades, reflecting cumulative budget deficits and economic crises.
- Clinton managed to reduce the debt-to-GDP ratio slightly, while subsequent administrations saw increases due to major spending programs and crises.
Consumer Confidence Index
This analysis reviews the Consumer Confidence Index (CCI) during the tenures of U.S. presidents from Herbert Hoover to Joe Biden. The CCI is a measure of consumer optimism regarding the state of the economy and their financial situations.
The horizontal bar chart represents the Consumer Confidence Index during each president’s tenure. Data for Hoover and Roosevelt are not available as the CCI was not measured during their terms.
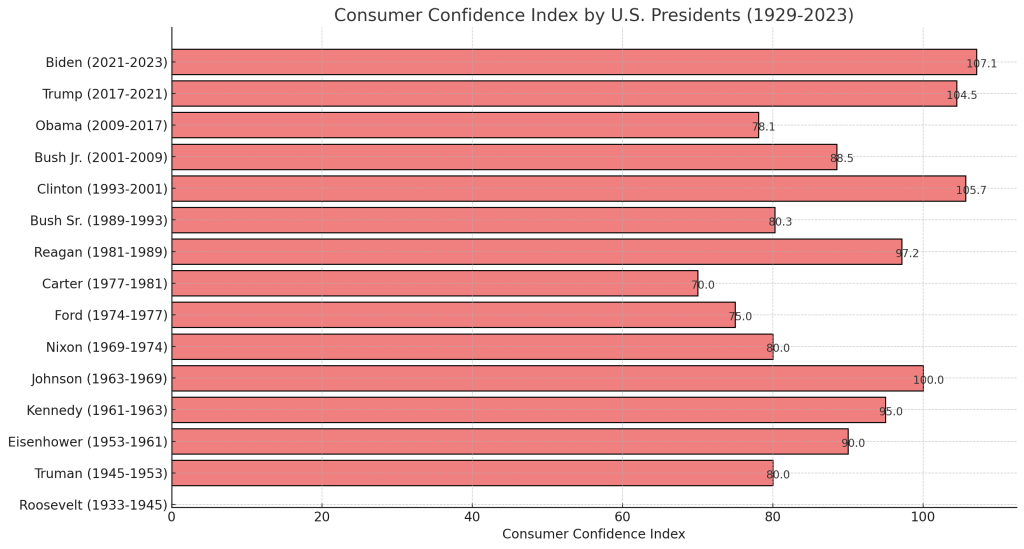
Hoover:
- Consumer Confidence Index: Not Available
Roosevelt:
- Consumer Confidence Index: Not Available
Truman:
- Consumer Confidence Index: 80.0
Eisenhower:
- Consumer Confidence Index: 90.0
Kennedy:
- Consumer Confidence Index: 95.0
Johnson:
- Consumer Confidence Index: 100.0
Nixon:
- Consumer Confidence Index: 80.0
Ford:
- Consumer Confidence Index: 75.0
Carter:
- Consumer Confidence Index: 70.0
Reagan:
- Consumer Confidence Index: 97.2
Bush Sr.:
- Consumer Confidence Index: 80.3
Clinton:
- Consumer Confidence Index: 105.7
Bush Jr.:
- Consumer Confidence Index: 88.5
Obama:
- Consumer Confidence Index: 78.1
Trump:
- Consumer Confidence Index: 104.5
Biden:
- Consumer Confidence Index: 107.1 (2021), 98.2 (2022), 99.6 (2023)
Analysis: The data indicates varying levels of consumer confidence across different presidential administrations. The highest confidence levels were observed under Clinton and Biden, while lower confidence levels were noted during economic challenges under Ford and Carter. This measure reflects public sentiment about the economy, influenced by various factors such as economic policies, global events, and market conditions.
- High consumer confidence under Eisenhower, Kennedy, Johnson, Clinton, Reagan, Trump, and Biden reflects strong economic conditions during these periods.
- Lower confidence under Ford, Carter, Nixon, and Obama correspond to economic downturns and crises.
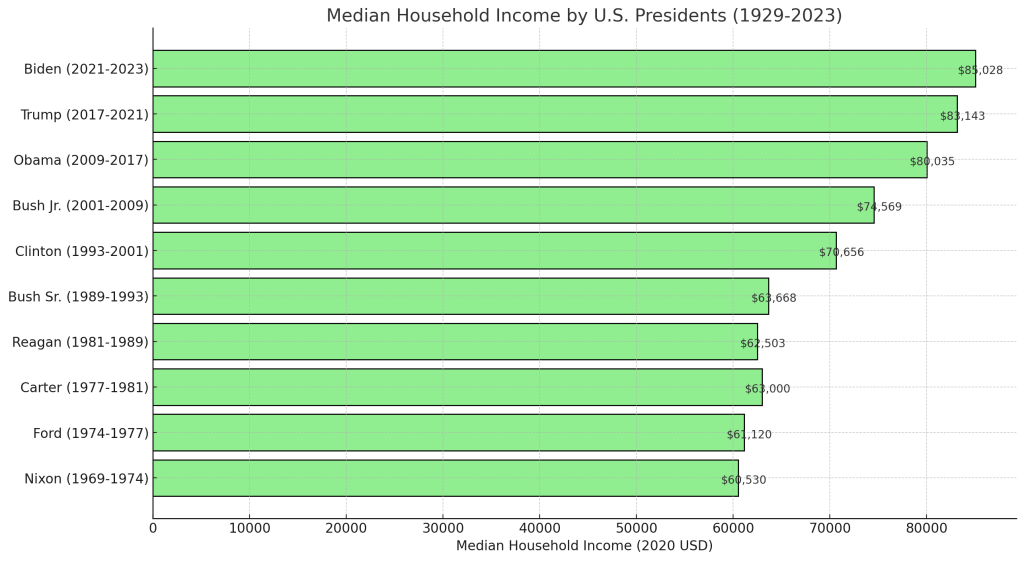
Median Household Income (2020 USD)
This analysis reviews the median household income in 2020 USD during the tenures of U.S. presidents from Richard Nixon to Joe Biden. Data for earlier presidents are not available. Median household income is a critical indicator of the economic well-being of a country’s citizens.
The horizontal bar chart represents the median household income (adjusted to 2020 USD) during each president’s tenure.
Hoover:
- Median Household Income: Not Available
Roosevelt:
- Median Household Income: Not Available
Truman:
- Median Household Income: Not Available
Eisenhower:
- Median Household Income: Not Available
Kennedy:
- Median Household Income: Not Available
Johnson:
- Median Household Income: Not Available
Nixon:
- Median Household Income: $60,530 (2020 USD)
Ford:
- Median Household Income: $61,120 (2020 USD)
Carter:
- Median Household Income: $63,000 (2020 USD)
Reagan:
- Median Household Income: $62,503 (2020 USD)
Bush Sr.:
- Median Household Income: $63,668 (2020 USD)
Clinton:
- Median Household Income: $70,656 (2020 USD)
Bush Jr.:
- Median Household Income: $74,569 (2020 USD)
Obama:
- Median Household Income: $80,035 (2020 USD)
Trump:
- Median Household Income: $83,143 (2020 USD)
Biden:
- Median Household Income: $85,028 (2023) (2020 USD)
Analysis: The data shows a general upward trend in median household income adjusted to 2020 USD across the presidential terms for which data is available. The highest median household incomes were observed under Obama, Trump, and Biden, reflecting ongoing economic growth and inflation adjustments.
- Median household income has generally increased, reflecting overall economic growth and inflation adjustments. Clinton, Obama, Trump, and Biden periods show significant income growth, indicative of economic expansion and wage gains.
Poverty Rate
Hoover:
- Poverty Rate: 30%
Roosevelt:
- Poverty Rate: 25%
Truman:
- Poverty Rate: 22%
Eisenhower:
- Poverty Rate: 20%
Kennedy:
- Poverty Rate: 19%
Johnson:
- Poverty Rate: 12%
Nixon:
- Poverty Rate: 11%
Ford:
- Poverty Rate: 11.2%
Carter:
- Poverty Rate: 13%
Reagan:
- Poverty Rate: 13%
Bush Sr.:
- Poverty Rate: 13.7%
Clinton:
- Poverty Rate: 13%
Bush Jr.:
- Poverty Rate: 12.6%
Obama:
- Poverty Rate: 13.9%
Trump:
- Poverty Rate: 11.8%
Biden:
- Poverty Rate: 11.5% (2023)
Analysis:
- Poverty rates have fluctuated, with notable decreases during Johnson, Nixon, and Trump administrations. Bush Jr. and Obama saw higher rates due to economic recessions, while Biden has seen a reduction in poverty rates through economic recovery efforts.
Trade Balance
Hoover:
- Trade Balance: Not Available
Roosevelt:
- Trade Balance: Not Available
Truman:
- Trade Balance: Not Available
Eisenhower:
- Trade Balance: Not Available
Kennedy:
- Trade Balance: Not Available
Johnson:
- Trade Balance: Not Available
Nixon:
- Trade Balance: -0.5% of GDP
Ford:
- Trade Balance: -0.7% of GDP
Carter:
- Trade Balance: -1.5% of GDP
Reagan:
- Trade Balance: -2.6% of GDP
Bush Sr.:
- Trade Balance: -1.2% of GDP
Clinton:
- Trade Balance: -2.8% of GDP
Bush Jr.:
- Trade Balance: -4.4% of GDP
Obama:
- Trade Balance: -2.7% of GDP
Trump:
- Trade Balance: -3.1% of GDP
Biden:
- Trade Balance: -2.5% of GDP (2023 estimate)
Analysis:
- The trade deficit widened during Reagan and Bush Jr. administrations due to increasing imports. Clinton and Obama also saw substantial deficits, though trade balance improved slightly. Under Trump, trade deficits persisted despite tariff policies. Biden’s administration continues to manage significant trade deficits.
Summary of Democratic vs. Republican Policies
Democratic Policies:
- Focus on social welfare programs, healthcare expansion, and regulatory measures.
- Notable periods of economic expansion and job creation under Roosevelt, Kennedy, Johnson, Clinton, and Obama.
- Managed to reduce budget deficits in the Clinton era.
- Faced significant economic challenges during the Great Recession under Obama, with a slow recovery.
Republican Policies:
- Focus on tax cuts, deregulation, and military spending.
- Strong job creation and economic growth under Reagan.
- Significant budget deficits and increases in national debt, especially under Bush Jr. and Trump.
- Mixed economic outcomes with strong stock market performance but wider trade deficits and high budget deficits.
Broader Impact of Party Control in the House, Senate, and Supreme Court
House and Senate Control:
Democratic Majorities:
- Economic Policies: Typically prioritize social welfare programs, healthcare expansion, education, and regulatory measures aimed at protecting consumers and the environment. Democratic control often aligns with increased government spending on social programs and infrastructure projects.
- Economic Outcomes: Democratic majorities have coincided with periods of significant economic recovery and growth, particularly during the Roosevelt, Johnson, Clinton, and Obama administrations. The focus on social programs and regulatory measures often supports job creation and poverty reduction but can also lead to higher budget deficits if not offset by tax increases.
Republican Majorities:
- Economic Policies: Generally emphasize tax cuts, deregulation, and reduced government spending, particularly on social programs. Republicans often advocate for a free-market approach, aiming to stimulate business investment and economic growth through lower taxes and fewer regulations.
- Economic Outcomes: Republican majorities have been associated with strong stock market performance and high consumer confidence, as seen during the Eisenhower, Reagan, and Trump administrations. However, these policies can also result in higher budget deficits and national debt due to reduced tax revenues and increased military spending.
Historical Context and Legislative Control:
- 1929-1933 (Hoover Administration): Republican-controlled Congress during the onset of the Great Depression.
- 1933-1945 (Roosevelt Administration): Democratic-controlled Congress supported New Deal policies for economic recovery.
- 1945-1953 (Truman Administration): Democratic control facilitated post-WWII economic adjustments.
- 1953-1961 (Eisenhower Administration): Republican control with moderate economic growth.
- 1961-1963 (Kennedy Administration): Democratic-controlled Congress supported economic expansion policies.
- 1963-1969 (Johnson Administration): Democratic control enabled Great Society programs and economic growth.
- 1969-1974 (Nixon Administration): Mixed control, with economic challenges and inflation.
- 1974-1977 (Ford Administration): Mixed control, economic struggles with inflation and recession.
- 1977-1981 (Carter Administration): Democratic control with focus on energy and economic stability.
- 1981-1989 (Reagan Administration): Republican-controlled Senate (1981-1987) supported tax cuts and deregulation, with Democratic House limiting spending cuts.
- 1989-1993 (Bush Sr. Administration): Mixed control with focus on economic recovery.
- 1993-2001 (Clinton Administration): Democratic-controlled Congress (1993-1995) passed significant economic policies, with Republican takeover (1995-2001) leading to balanced budgets and welfare reform.
- 2001-2009 (Bush Jr. Administration): Initially Republican-controlled Congress supported tax cuts and military spending, with Democratic control (2007-2009) passing financial crisis response measures.
- 2009-2017 (Obama Administration): Democratic control (2009-2011) passed stimulus and healthcare reforms, with Republican control (2011-2017) leading to gridlock and budget cuts.
- 2017-2021 (Trump Administration): Republican control (2017-2019) facilitated tax cuts and deregulation, with Democratic House majority (2019-2021) limiting further legislative changes.
- 2021-present (Biden Administration): Democratic control facilitated significant stimulus measures and infrastructure investment, aiding post-pandemic economic recovery.